Guide to the Statistical Reports
Market Analysis
- Use this report to view state-wide Residential listing statistics in status-based tables and interactive charts.
- Property Classes Available: Residential
- Years Searchable: 1-5 years
The Market Analysis breaks down data regarding Residential Listings based on when they were published (Listings Entered), when their transaction status changed (Active, Backup, Active-No Show, Under Contract, Sold, and Back-To-Market).
While on the site, graphs function with some interactivity, such as data breakdowns when hovering your mouse over the graph, hovering over a year in the graph key to highlight it, or removing the data from a year by clicking on that year in the graph key.
Graphs can be exported from this analysis via the Chart Context Menu, represented by the 3 stacked horizontal lines in the upper-right corner of each chart. Please note, graphs will export with full data, and downloaded files will not deliver the same interactivity as the graph.
Tables can be exported from this analysis via the two Download [Type] file buttons above each table.
Absorption Report
- Use this report to calculate how quickly current housing inventory might turn over (absorb) if sold as quickly as inventory in the last two, three, four, five, six, or twelve months.
- Property Classes Available: Residential
- Years Searchable: 1
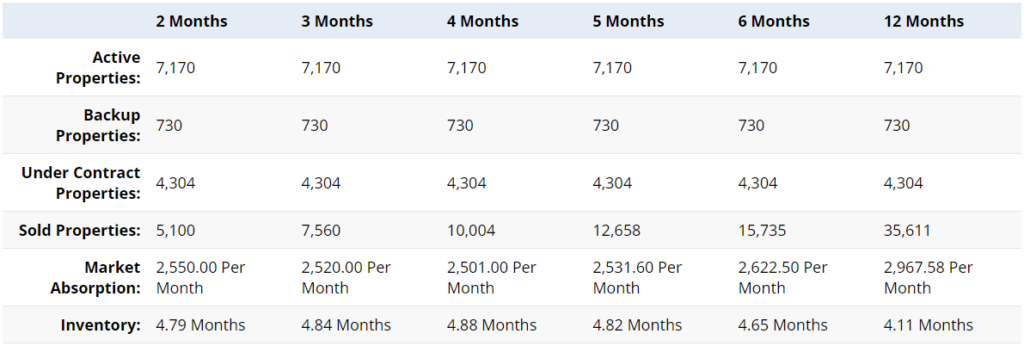
The Absorption Report makes two calculations:
- How many properties have been sold per month? This is commonly called the Absorption rate.
- At that rate, how many months it will take to sell (absorb) the current inventory?
If 10 homes have sold in the last 2 months, the Market Absorption is 5 homes per month. If there are 15 homes currently available, the Absorption Report estimates it will take 3 months to sell those 15 homes.
Because Under Contract Properties are neither Sold nor Active, the Calculation Method allows you to choose between:
- Including Under Contract Listings with Active Listings (Under Contract properties will be calculated as current inventory available to be sold)
- Including Under Contract Listings with Sold Listings (Under Contract properties will be calculated as having already been sold)
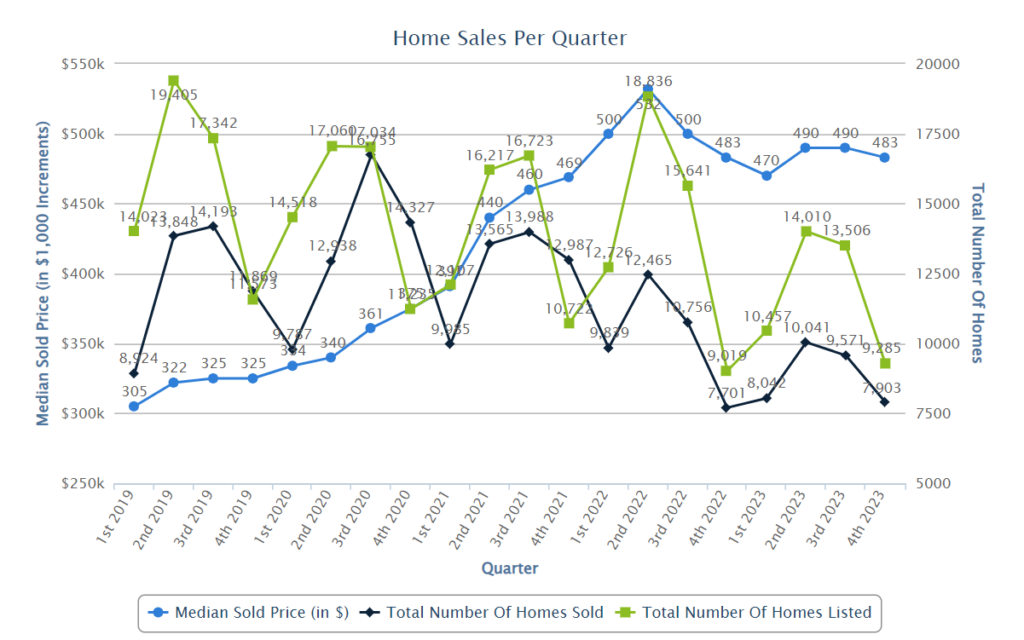
Home Sales Graphs
- Use this report to view the performance of total number of properties listed, total number of properties sold, and the median (or average) sales price.
- Property Classes Available: Residential
- Years Searchable: 1996-Present
These graphs are broken down by quarter.
Market Summary Report
- Use this report to see a summary (quantity, low price, high price, median price, average price, and median DOM) of listings by status and by price point.
- Property Classes Available: Residential, Multi Unit, Land, Farm, and Commercial
- Years Searchable: 1996-Present
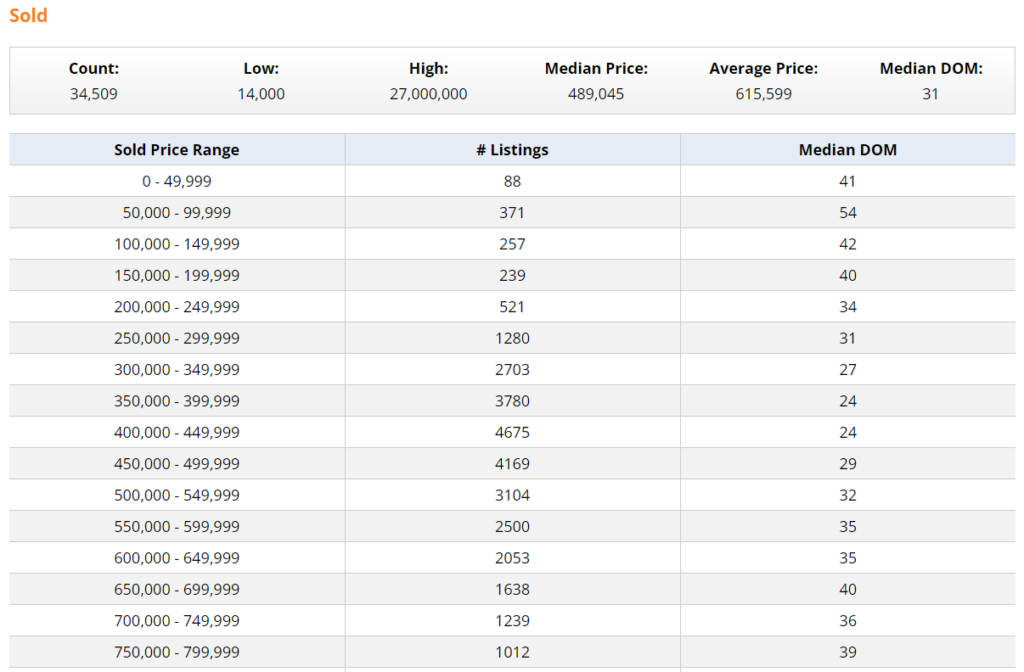
The Market Summary Report calculates the total number, lowest price, highest price, median price, average price, and median (or average) DOM of listings in Active, Backup, Under Contract, Expired, Canceled and Sold statuses. The listings in each status are then grouped into price increments.
By default, the system will display all listings (that match your search criteria) back to November of 1995. To change this, use the Date Fields.
Quarterly Comparison Report
- Use this report to compare the current and previous years’ quarterly, annual, and year-to-date sales performance by percentage change.
- Property Classes Available: Residential, Multi Unit, Land, Farm, and Commercial
- Years Searchable: 2011-Present
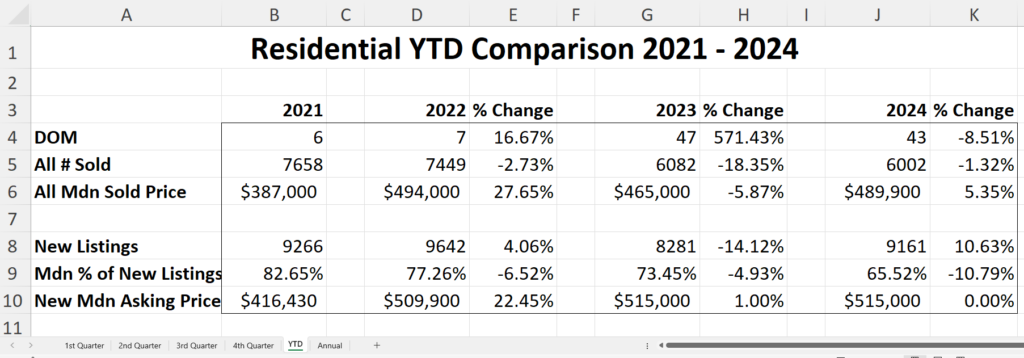
The Quarterly Comparison Report opens in spreadsheet format. Although defaulting to Excel (XLS) format, several other formats will be available to choose from. It is designed to show the percentage change in home sales statistics by quarter (year-over-year).
Each quarter is displayed in a separate tab at the bottom of the spreadsheet, along with the YTD (year-to-date) and Annual statistics. Each of these tabs displays the following:
- Average or Median DOM
- Total number of homes sold (in that quarter or year)
- Average or Median Sold Price
- Number of New Listings (in that quarter or year)
- Average or Median percentage of new listings vs. sold listings
- Average or Median Asking Price (list price)
- The percentage of change compared to prior year(s)
Sales Per Month Report
- Use this report to access monthly sales and listing data including sales volume, sales price compared to list price, price per square foot, and Days on Market (DOM)
- Property Classes Available: Residential
- Years Searchable: 1996-Present
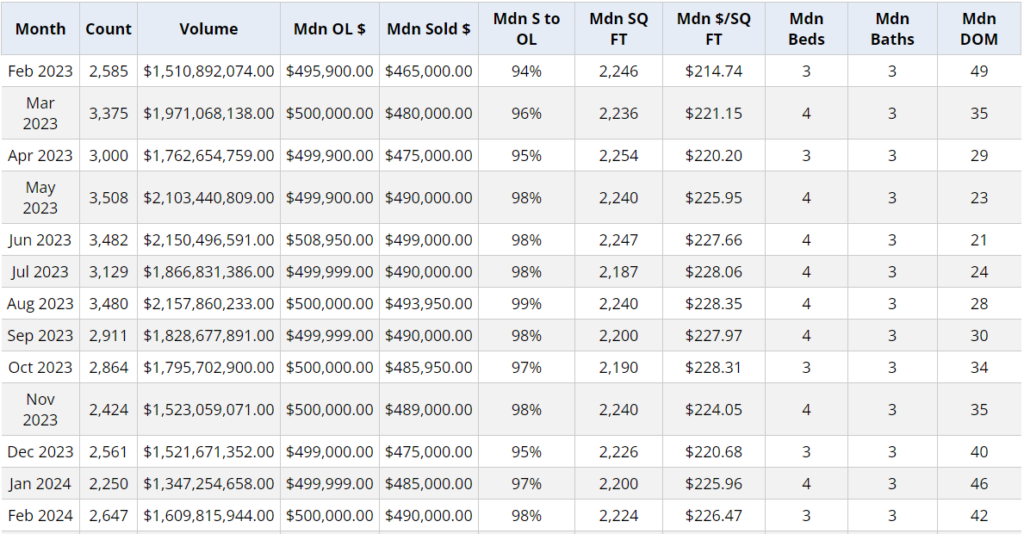
The Sales per Month Report is designed to display monthly statistics of the sold listings that match your search criteria in the following categories:
- Month and Year of the Data
- Number of homes sold per month
- Total dollar volume of home sales per month
It also displays the Average or Median:
- OL (Original List Price)
- Sold Price (not adjusted for concessions)
- Percentage of Sold to Original List Price
- Square Footage
- Price per Square Foot
- Total Bedrooms
- Total Bathrooms
- DOM (Days on Market)
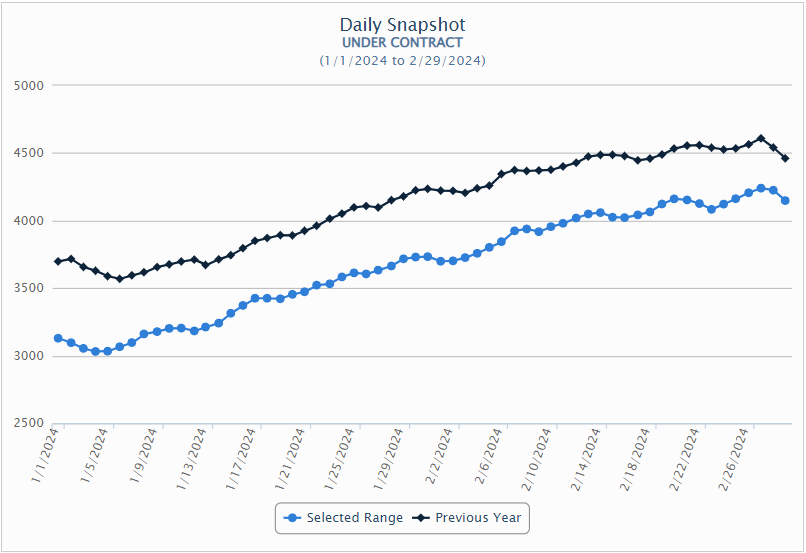
Daily Snapshot Report
- Use this report to compare the number of Active, Backup, Under Contract, Withdrawn, and Off Market listings on a specific day, or within a selected date range, with historical data.
- Property Classes Available: Residential, Multi Unit, Land, Farm, and Commercial
- Years Searchable: 2011-Present