Introduction to RapidStats

What is RapidStats?
RapidStats is a data-driven reporting and analytics tool that helps brokers and agents understand their markets, pricing, trends, and opportunities. Consider RapidStats a one-stop-shop for reporting and analytics. The customizable reports compile data sourced directly from UtahRealEstate.com and give you timely, accurate, and comprehensive information, leading to powerful market insights for you and your clients.
How do I Use RapidStats?
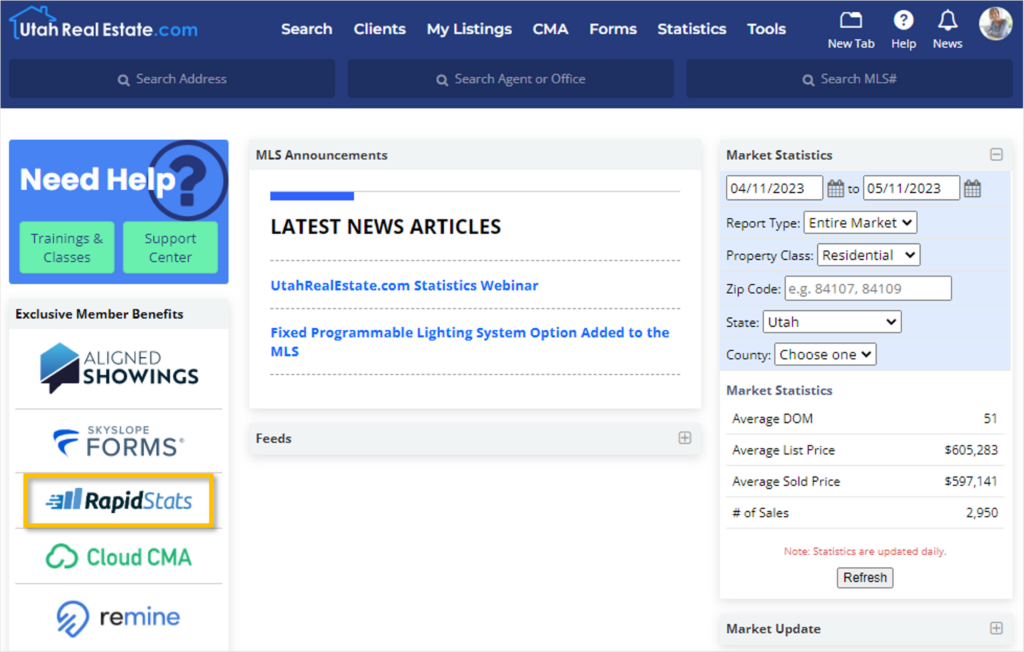
Access RapidStats from the UtahRealEstate.com Exclusive Member Benefits section on the MLS Dashboard. Selecting the RapidStats logo will take you to your RapidStats Dashboard with no additional login required.
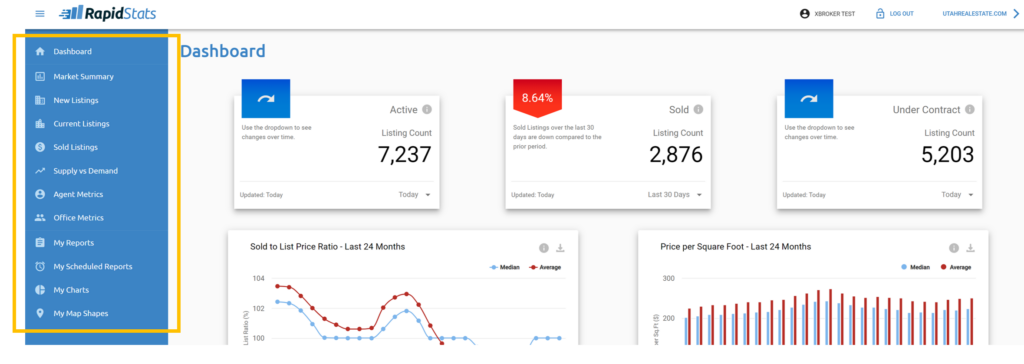
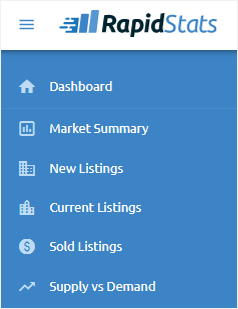
The main menu on the left side of the application allows you to easily access all of the different reports and tools RapidStats has to offer.
RapidStats Dashboard
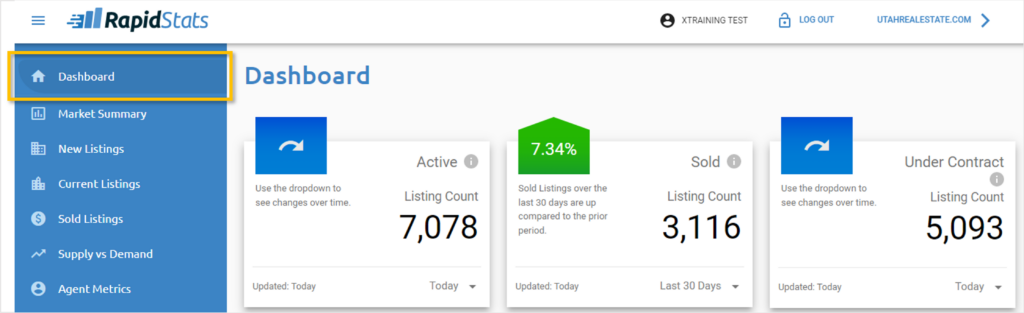
The dashboard is the landing place where you are taken when you access RapidStats. The Active, Sold, and Under Contract widgets are updated daily and allow you to quickly compare the most recent data to a snapshot in time going 30, 60, 90, 180, or 365 days back.
The Sold to List Price Ratio – Last 24 Months widget, the Price per Square Foot – Last 24 Months widget, and the Supply vs Demand – Last 48 Months widget display comparison reports in interactive charts for easy review. These widgets allow you to:
- Click and drag your mouse on the chart to narrows down the data and focus on a specific timeframe
- Select and de-select the information you want to include or exclude from the chart (For example, clicking on Median will show/hide that data from the chart)
- Download/Print the chart
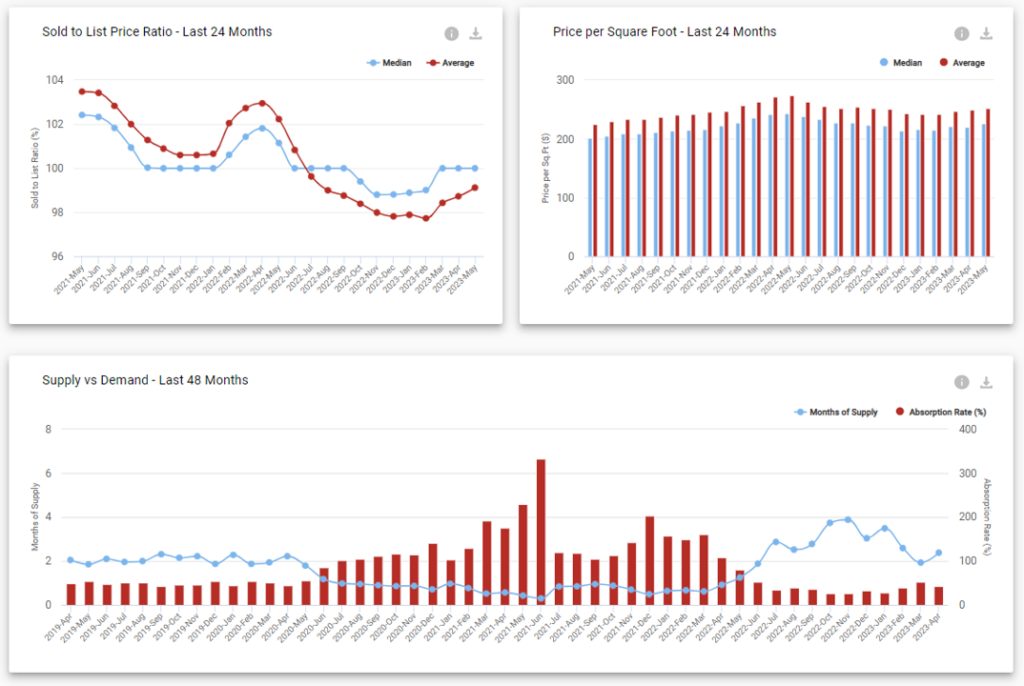
Note: If you zoom in on an area of the chart before selecting print/download, only the zoomed-in view will be printed/downloaded.
What Types of Reports Can I Access from the RapidStats Menu?
Reports in the menu are divided into general categories, including:
- Market Summary provides an overview of the prior calendar month
- New Listings provides data on new listings entering the market over time
- Current Listings provides statistics about properties currently in the Active, Backup, and Under Contract statuses.
- Sold Listings provides statistics about closed transactions for the current and prior year, broken down by month to date (MTD), quarter to date (QTD), and year to date (YTD)
- Supply vs Demand provides data about Supply (Active Listings) compared with Demand (Sold Listings)
Within each tab are various statistics reports for both Residential and Rental listings. The first report in each tab is a high-level summary.
The New Listings, Current Listings, Sold Listings, and Supply vs Demand Tabs all have reports breaking down data by:
- Price Range
- Sq Ft Range
- Dwelling Type
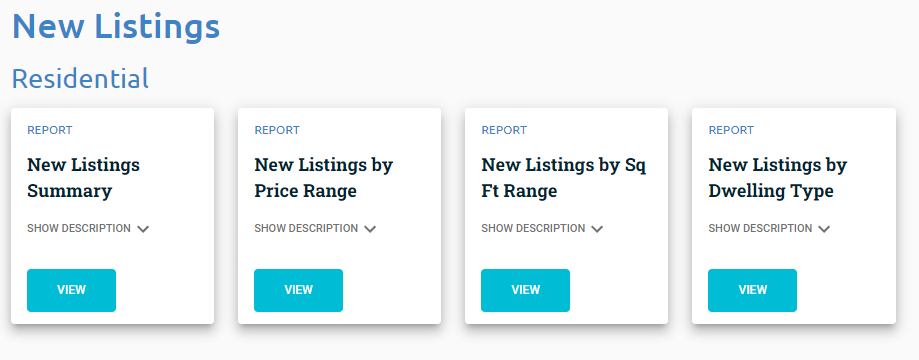
Open any report by selecting the blue View button. By default, the report will include all residential or rental data for the entire State of Utah. Use the various filter options (such as city or zip code) at the top of each report to customize the type of information used to run the report.
Each report can be Printed, Downloaded, or Saved to My Reports. You can also include a Cover Page with your contact information, as well as a Definitions Page which provides definitions related to the information included in the report.
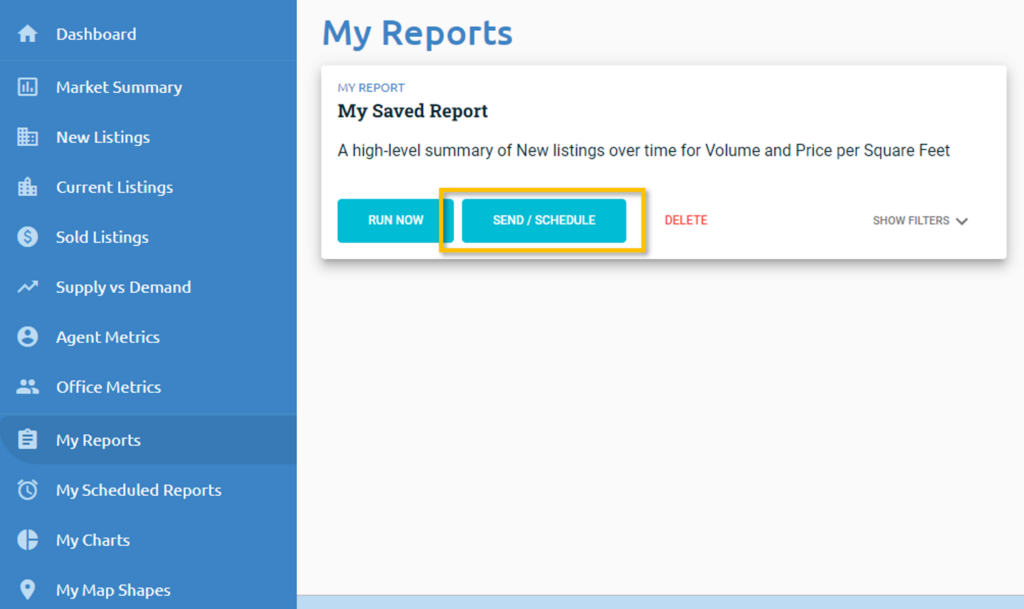
What are My Reports?
In My Reports, you can access the reports you’ve saved. Similar to a Saved Search in UtahRealEstate.com, using Save to My Reports will save the search criteria for the statistics report, not the results of the report at the time it was saved, allowing you to quickly re-generate that report at a later time with up-to-date data.
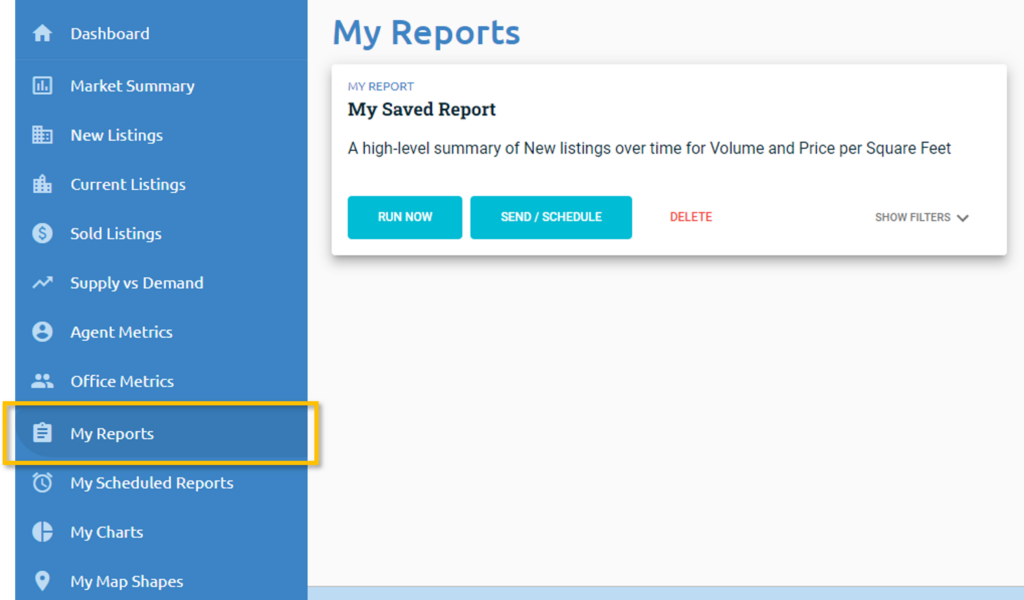
Use the Send/Schedule button on My Reports to email a one time report, or you can setup recurring emails that can be automatically sent to you and/or your clients at a frequency of your choice (Weekly, Monthly, Quarterly, etc.). Similar to a Listing Alert, these reports can be scheduled to go out automatically using the three simple steps in the Report Scheduler. Once created, scheduled reports can be accessed and edited at any time within the My Scheduled Reports tab.
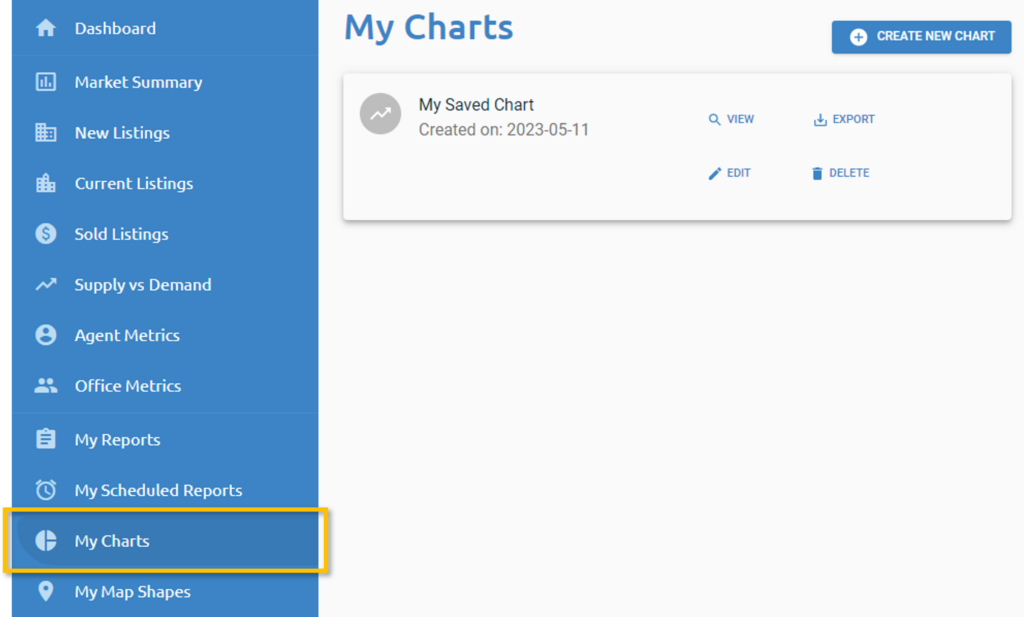
What are My Charts?
In My Charts, users can create custom statistics reports by selecting either Residential or Rental listings, choosing the listing status to include in the report, and a data point such as Number of Listings or Original List Price. My Charts has robust features that allow you to change the format of the graph (color, position and name of axis titles, etc.), layer multiple levels of data on the chart, etc.
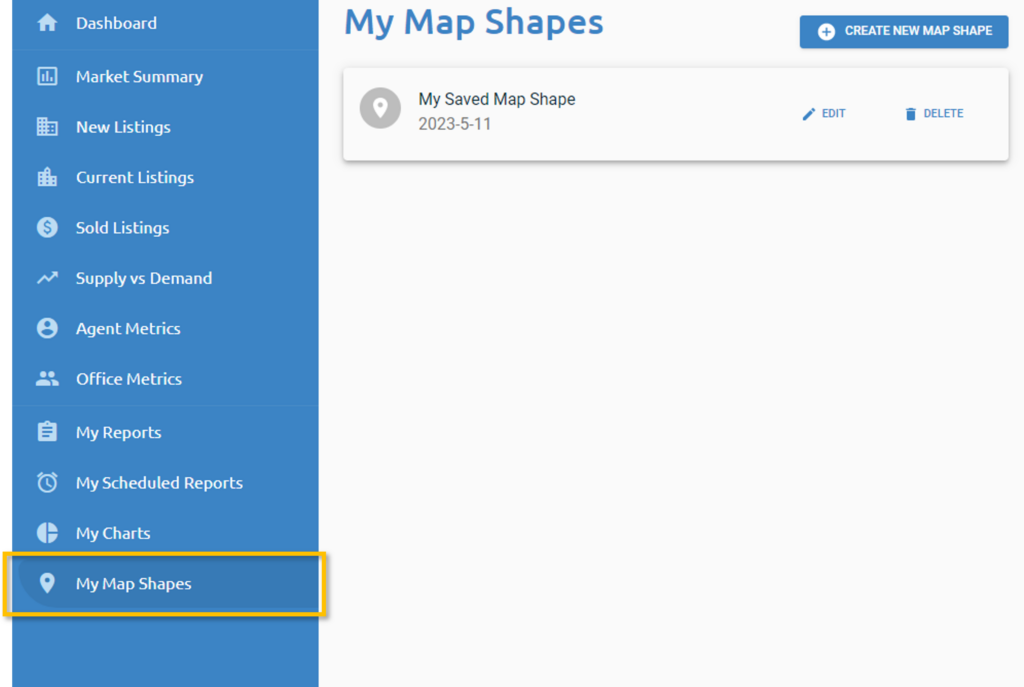
What are My Map Shapes?
My Map Shapes are custom map locations which can be drawn and saved to your account in order to search highly specific locations when pulling statistics reports. To create a map shape, select the blue Create New Map Shape button in the upper-right-hand corner. Once created, you will see My Map Shapes as a filter option when editing the criteria for data to include in a specific report.