Aligned Showings Reports
Aligned Showings has two reports available, the My Listings Activity report, and the Price Point Analysis report. In this article, we will break down the different options in each report.
My Listings Activity
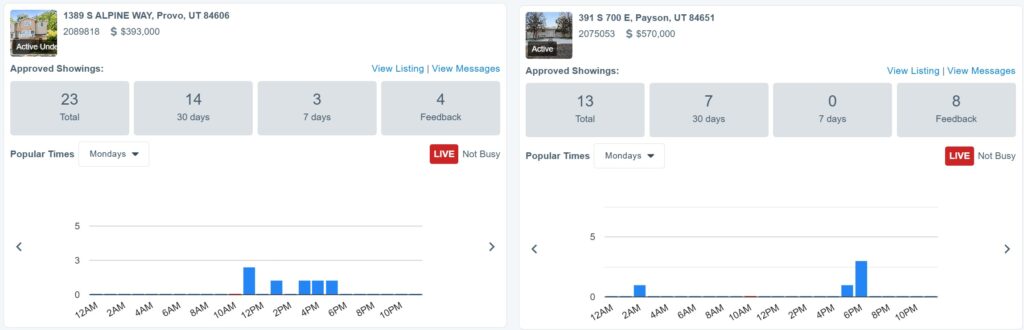
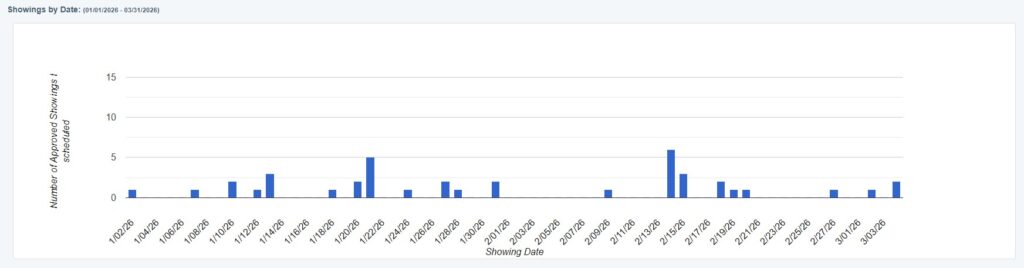
The My Listings Activity report shows the recent number of approved showings for each of your listings, as well as the popular time for showings. To access this report:
- Access your Aligned Showings account.
- Select Reports, then My Listings Activity.
My Showings Activity
The My Showings Activity is a report for showing agents to view showings they’ve scheduled on other listings. This report has a dropdown where you can select the buyer, with additional showing appointment information beneath the graph in this printable report. To access this report:
- Access your Aligned Showings account.
- Select Reports, then My Showings Activity.
Price Point Analysis
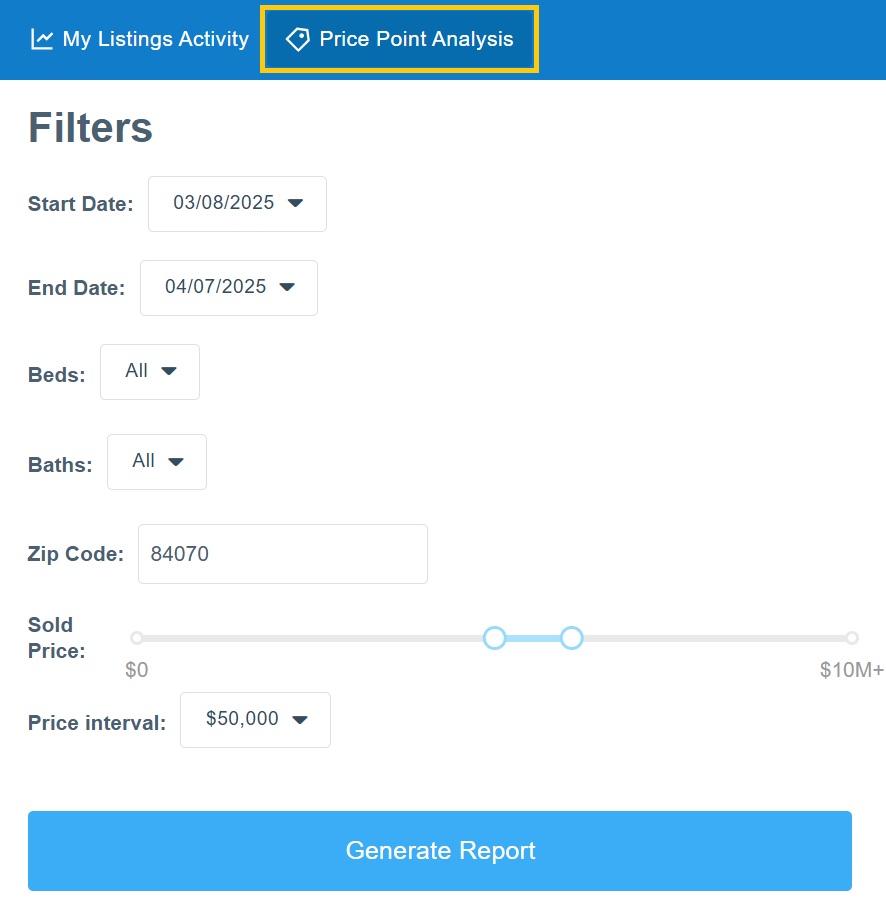
The Price Point Analysis report displays an analysis of the number of approved showings by price range for a particular zip code, or for all zip codes in the MLS. This indicates the price points where most showings have occurred for the selected date range. Here are the steps to generate the Price Point Analysis report:
- Access your Aligned Showings account
- Select Reports, then Price Point Analysis.
- Select the start and date for the report, the number of bedrooms, and the number of
bathrooms. - Enter the zip code or leave blank to include all zip codes in the MLS.
- Select the start and ending sold price.
- Select the price interval to determine where the price ranges will break. The price interval can be set to $10,000, $25,000, $50,000, $100,000. $250,000, and $500,000 increments.
- Select Generate Report to display the report.
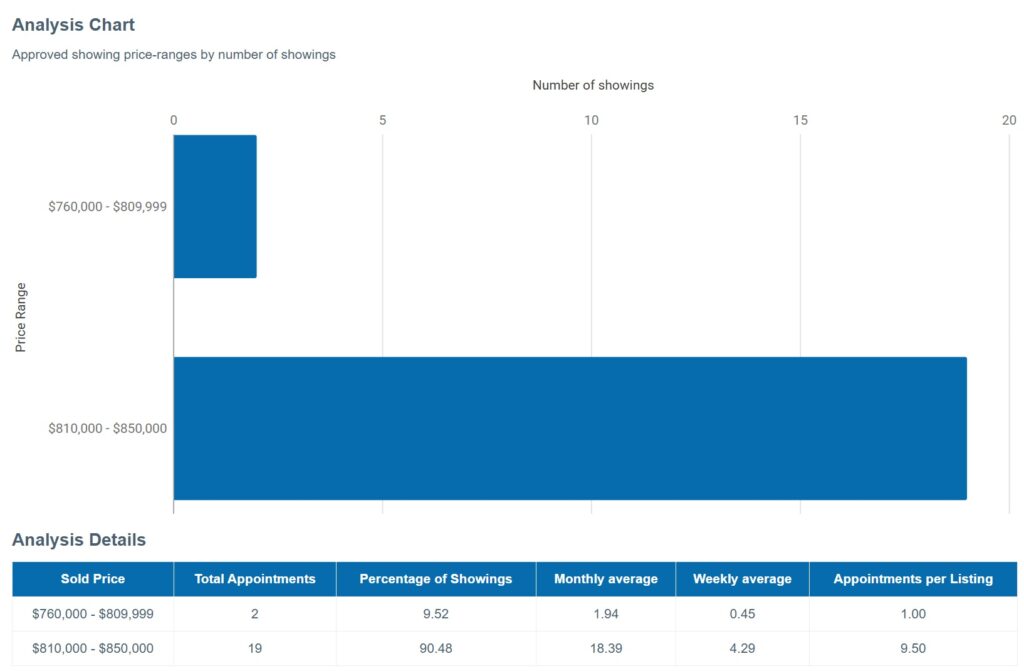
Select the Print button to print the report. You can also copy and paste the data from the Analysis Details table into an Excel spreadsheet.
The Analysis Details displays:
- Total Appointments: the total number of approved appointments for each price range
- Percentage of Showings: the percentage of showings for each price based on the total of
- showings for the report
- Monthly average: the number of approved showings adjusted to a monthly average
- Weekly average: the number of approved showings adjusted to a weekly average
- Appointments per Listing: the average number of appointments per listing
Daily Appointment Summary
The Daily Appointment Summary shows a report of daily appointments can be generated and printed for any future day. To access this report:
- Access your Aligned Showings account.
- Select Reports, then Daily Appointment Summary.
Choose the date and appointment type(s), and click on Generate Report. Select View Showing on an appointment to view the appointment in Messages, or Print to print out the report.
Listing Activity Report
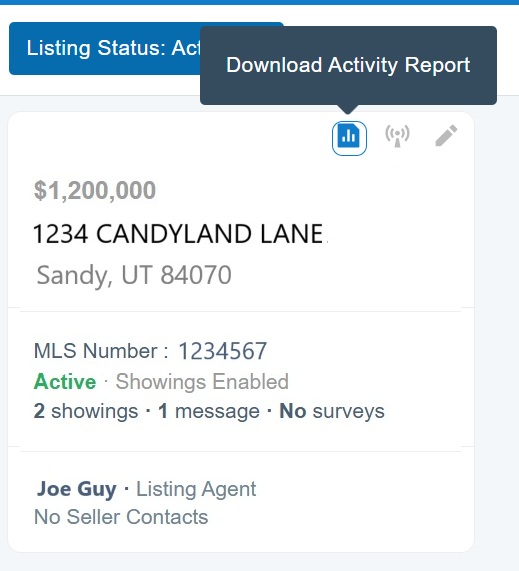
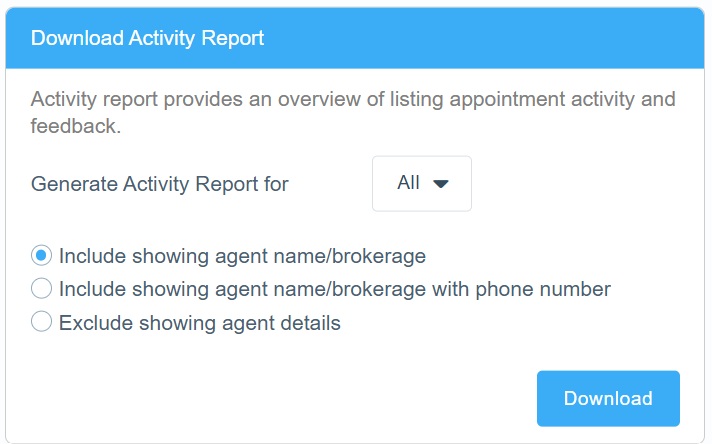
The isting Activity Report provides an easy way for listing agents to share showing activity and feedback with clients. The Listing Activity Report displays a summary of every approved showing appointment as well as feedback submitted for the listing. To view the Listing Activity Report for your listing:
- Access your Aligned Showings account.
- Select My Listings.
- Locate the listing in question and select the Download Activity Report icon.
- The report opens in PDF format and can be saved or printed.